Data-Dense Dashboard
Maximizes information density for power users who need to see everything at once. Every pixel serves a purpose.
Live demo
Requests
1.2M
+12%
Latency
23ms
-5%
Errors
0.02%
-18%
Users
45.2K
+8%
CPU
67%
+2%
Memory
4.2GB
+1%
Queue
234
-30%
Uptime
99.99%
0%
| Endpoint | Requests | P50 | P99 | Errors |
|---|---|---|---|---|
| /api/users | 45.2K | 12ms | 89ms | 0.01% |
| /api/orders | 32.1K | 23ms | 156ms | 0.03% |
| /api/products | 28.9K | 8ms | 45ms | 0.00% |
| /api/search | 18.4K | 145ms | 890ms | 0.12% |
About Data-Dense Dashboard
Maximizes information density for power users who need to see everything at once. Every pixel serves a purpose.
Era / origin
2020s Data Tools
Key characteristics
- Information density
- Multi-panel
- Compact tables
- Small multiples
- Data grids
- Power user
When to use Data-Dense Dashboard
- Complex data analysis
- Financial trading
- Operations monitoring
- Research tools
- Power users
When to avoid it
- Executive summaries
- Public dashboards
- Mobile-first
- Casual users
Common industries
- SaaS
- Fintech & Banking
- Corporate & B2B
Data-Dense Dashboard color palette
- #1F2937
- #FFFFFF
- #3B82F6
- #10B981
- #EF4444
- #F59E0B
- #E5E7EB
How to build Data-Dense Dashboard in CSS
Effects: Compact spacing, inline sparklines where series data exists (otherwise show the label and current value, no empty chart frames), sortable data tables, collapsible panels, tooltip details
:root {
  --color-text: #1F2937;
  --color-panel: #FFFFFF;
  --color-accent: #3B82F6;
  --color-up: #10B981;
  --color-down: #EF4444;
  --color-warn: #F59E0B;
  --color-border: #E5E7EB;
  --color-canvas: #F3F4F6;
  --color-muted: #6B7280;
}

body {
  background: var(--color-canvas);
  color: var(--color-text);
  font: 13px/1.4 Inter, system-ui, sans-serif;
  font-variant-numeric: tabular-nums;
}

.grid {
  display: grid;
  grid-template-columns: repeat(auto-fit, minmax(120px, 1fr));
  grid-auto-flow: dense;
  gap: 0.5rem;
  padding: 0.5rem;
}

.card {
  background: var(--color-panel);
  border: 1px solid var(--color-border);
  border-radius: 0.25rem;
  padding: 0.5rem;
}

.card-label { font-size: 0.75rem; color: var(--color-muted); }
.card-value { font-size: 1.125rem; font-weight: 700; }

/* Good / bad / warning values, darkened for text contrast */
.delta-up { color: #047857; }
.delta-down { color: #DC2626; }
.value-warn { color: #B45309; }

/* Every panel header: title left, toggle and meta right */
.panel-header {
  display: flex;
  align-items: center;
  gap: 0.5rem;
}

.panel-header > :is(h2, h3) {
  order: -1;
  margin: 0 auto 0 0;
  font-size: 0.8125rem;
}

.table { width: 100%; border-collapse: collapse; }

.table th {
  background: #F9FAFB;
  color: var(--color-muted);
  font-size: 0.75rem;
  font-weight: 500;
}

.table th,
.table td {
  padding: 0.375rem 0.75rem;
  border-bottom: 1px solid var(--color-border);
  text-align: right;
}

.table th:first-child,
.table td:first-child {
  text-align: left;
}

.table tbody tr:hover {
  background: #F9FAFB;
}

.table tbody tr:focus-visible {
  outline: 2px solid var(--color-accent);
  outline-offset: -2px;
}Use Data-Dense Dashboard with an AI coding agent
Paste this into Claude Code, Cursor, v0, Lovable or any coding agent to restyle a page in Data-Dense Dashboard.
Apply the Data-Dense Dashboard style to this interface.

What it is: Maximizes information density for power users who need to see everything at once. Every pixel serves a purpose.
Look and feel: Information density, Multi-panel, Compact tables, Small multiples, Data grids, Power user.
Colors: primary #1F2937, #FFFFFF, #3B82F6; secondary #10B981, #EF4444, #F59E0B, #E5E7EB.
Effects and motion: Compact spacing, inline sparklines where series data exists (otherwise show the label and current value, no empty chart frames), sortable data tables, collapsible panels, tooltip details.

Reference CSS (put these class names on the matching elements, or map them onto existing components and class names; avoid long structural selectors):
```css
:root {
  --color-text: #1F2937;
  --color-panel: #FFFFFF;
  --color-accent: #3B82F6;
  --color-up: #10B981;
  --color-down: #EF4444;
  --color-warn: #F59E0B;
  --color-border: #E5E7EB;
  --color-canvas: #F3F4F6;
  --color-muted: #6B7280;
}

body {
  background: var(--color-canvas);
  color: var(--color-text);
  font: 13px/1.4 Inter, system-ui, sans-serif;
  font-variant-numeric: tabular-nums;
}

.grid {
  display: grid;
  grid-template-columns: repeat(auto-fit, minmax(120px, 1fr));
  grid-auto-flow: dense;
  gap: 0.5rem;
  padding: 0.5rem;
}

.card {
  background: var(--color-panel);
  border: 1px solid var(--color-border);
  border-radius: 0.25rem;
  padding: 0.5rem;
}

.card-label { font-size: 0.75rem; color: var(--color-muted); }
.card-value { font-size: 1.125rem; font-weight: 700; }

/* Good / bad / warning values, darkened for text contrast */
.delta-up { color: #047857; }
.delta-down { color: #DC2626; }
.value-warn { color: #B45309; }

/* Every panel header: title left, toggle and meta right */
.panel-header {
  display: flex;
  align-items: center;
  gap: 0.5rem;
}

.panel-header > :is(h2, h3) {
  order: -1;
  margin: 0 auto 0 0;
  font-size: 0.8125rem;
}

.table { width: 100%; border-collapse: collapse; }

.table th {
  background: #F9FAFB;
  color: var(--color-muted);
  font-size: 0.75rem;
  font-weight: 500;
}

.table th,
.table td {
  padding: 0.375rem 0.75rem;
  border-bottom: 1px solid var(--color-border);
  text-align: right;
}

.table th:first-child,
.table td:first-child {
  text-align: left;
}

.table tbody tr:hover {
  background: #F9FAFB;
}

.table tbody tr:focus-visible {
  outline: 2px solid var(--color-accent);
  outline-offset: -2px;
}
```

Works best for: Complex data analysis, Financial trading, Operations monitoring, Research tools, Power users.
Avoid it for: Executive summaries, Public dashboards, Mobile-first, Casual users. If this product falls into one of those, say so before restyling.

Restructure the layout where this style calls for it, keeping the existing content and behaviour. Use only content already on the page: if a step needs testimonials, pricing, data, images or media that don't exist, skip that step instead of adding placeholders or inventing it.
Meet WCAG AA contrast: where a palette color is too light or bright for text, keep it for backgrounds, borders and large display type and use a darker text color, rather than darkening the whole design. Keep visible focus states, give icon-only controls an accessible name (aria-label) and respect prefers-reduced-motion.Rolling AI coding agents out across a team? Farad Labs runs hands-on AI training.
Styles like Data-Dense Dashboard
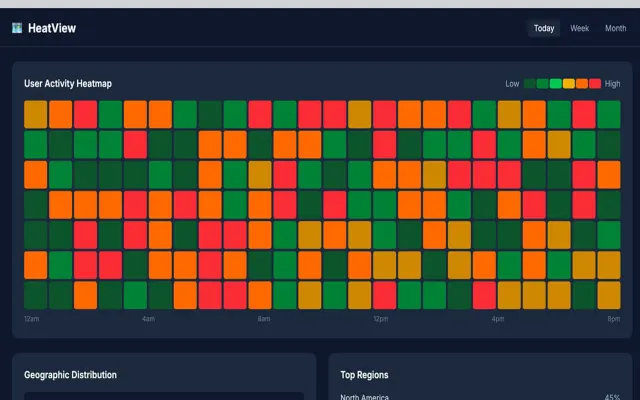
Heatmap Dashboard
Uses color intensity to reveal patterns in large datasets. Perfect for geographic, behavioral, or time-series data.
BI & Analytics
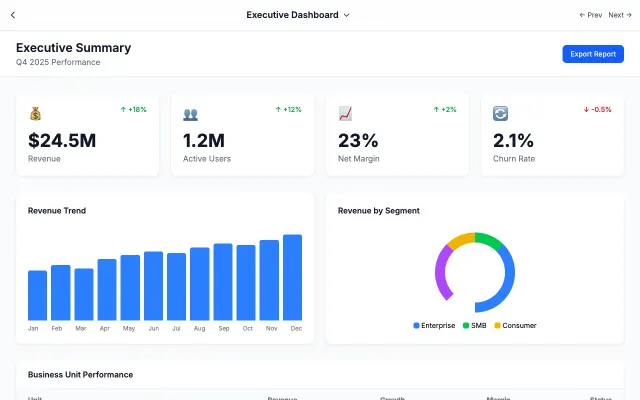
Executive Dashboard
Distills complex data into key metrics. Large numbers, clear trends, and minimal noise for busy executives.
BI & Analytics
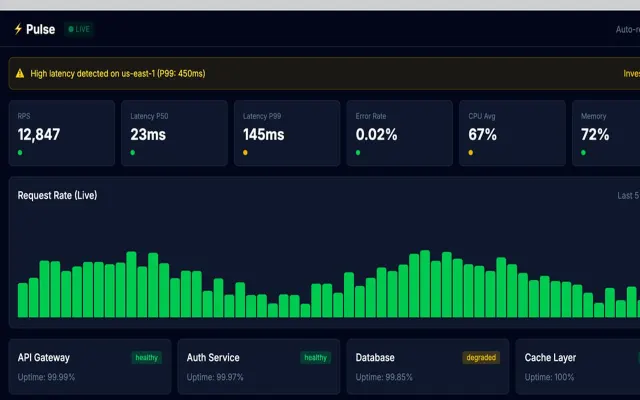
Real-Time Monitoring
Built for operations centers with live-updating metrics, streaming charts, and instant alert visibility.
BI & Analytics
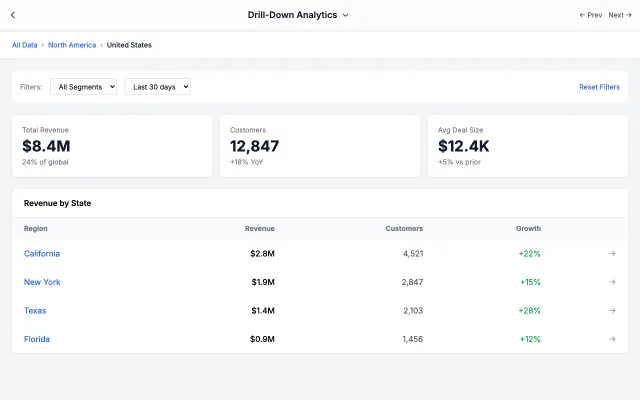
Drill-Down Analytics
Start with the big picture, drill into details. Perfect for analysts who need to explore data at multiple levels.
BI & Analytics