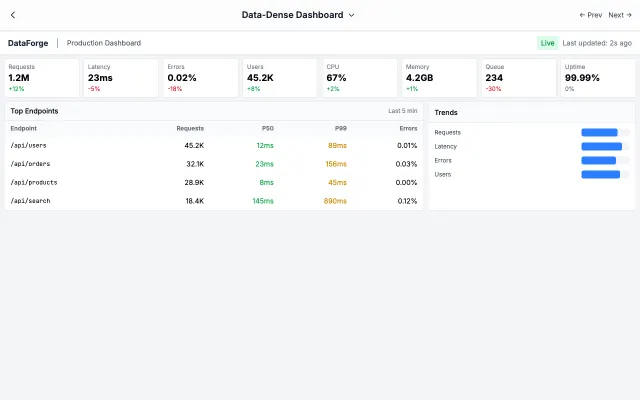
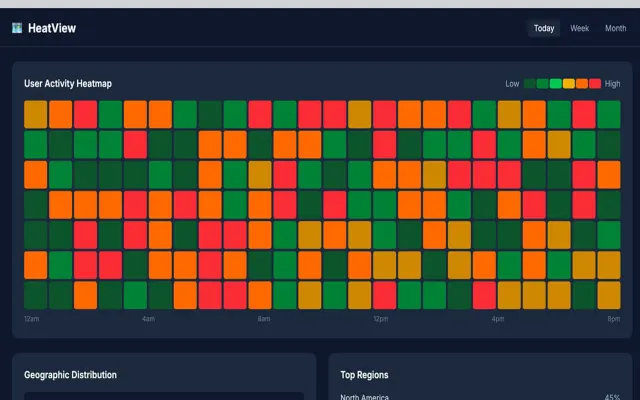
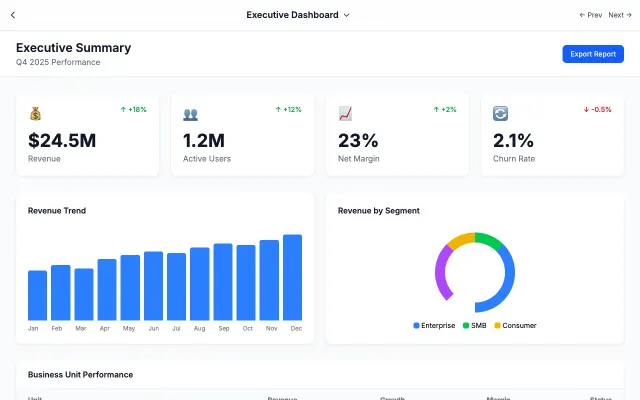
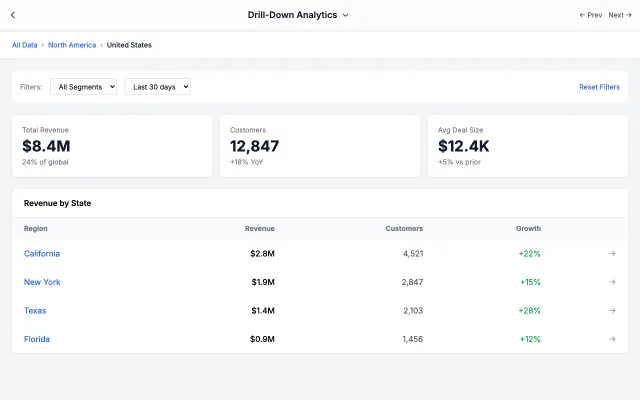
Built for operations centers with live-updating metrics, streaming charts, and instant alert visibility.
Era / origin
2020s DevOps
Key characteristics
Live data
Streaming
Alerts
Status indicators
Time-series
Operations center
When to use Real-Time Monitoring
DevOps monitoring
Server health
IoT dashboards
Trading floors
Security operations
When to avoid it
Historical analysis
Report generation
Offline use
Mobile viewing
Common industries
SaaS
Fintech & Banking
Corporate & B2B
Real-Time Monitoring color palette
#0F172A
#FFFFFF
#22C55E
#EF4444
#F59E0B
#3B82F6
#8B5CF6
How to build Real-Time Monitoring
Effects: Live updating numbers, streaming charts, alert animations, status pulse, auto-refresh
Show a LIVE badge and the refresh interval in the header; update at that interval, with a marked stub where a WebSocket/SSE feed connects
If there is an active incident, pin an alert banner above everything with an Investigate link
Run a dense strip of 4–6 metric tiles; colour each status dot from thresholds in the content, or keep it neutral
Render rolling time-series with uPlot or ECharts, or an inline SVG/canvas sparkline from existing values; append points without full re-renders
If the page lists services, finish with a grid of cards showing a health badge and uptime
Announce each new alert once via aria-live; under prefers-reduced-motion stop pulses and transitions but keep values updating in place
Use Real-Time Monitoring with an AI coding agent
Paste this into Claude Code, Cursor, v0, Lovable or any coding agent to restyle a page in Real-Time Monitoring.
AI prompt · 20 lines
Apply the Real-Time Monitoring style to this interface.

What it is: Built for operations centers with live-updating metrics, streaming charts, and instant alert visibility.
Look and feel: Live data, Streaming, Alerts, Status indicators, Time-series, Operations center.
Colors: primary #0F172A, #FFFFFF, #22C55E; secondary #EF4444, #F59E0B, #3B82F6, #8B5CF6.
Effects and motion: Live updating numbers, streaming charts, alert animations, status pulse, auto-refresh.

How to build it:
- Show a LIVE badge and the refresh interval in the header; update at that interval, with a marked stub where a WebSocket/SSE feed connects
- If there is an active incident, pin an alert banner above everything with an Investigate link
- Run a dense strip of 4–6 metric tiles; colour each status dot from thresholds in the content, or keep it neutral
- Render rolling time-series with uPlot or ECharts, or an inline SVG/canvas sparkline from existing values; append points without full re-renders
- If the page lists services, finish with a grid of cards showing a health badge and uptime
- Announce each new alert once via aria-live; under prefers-reduced-motion stop pulses and transitions but keep values updating in place

Works best for: DevOps monitoring, Server health, IoT dashboards, Trading floors, Security operations.
Avoid it for: Historical analysis, Report generation, Offline use, Mobile viewing. If this product falls into one of those, say so before restyling.

Restructure the layout where this style calls for it, keeping the existing content and behaviour. Use only content already on the page: if a step needs testimonials, pricing, data, images or media that don't exist, skip that step instead of adding placeholders or inventing it.
Meet WCAG AA contrast: where a palette color is too light or bright for text, keep it for backgrounds, borders and large display type and use a darker text color, rather than darkening the whole design. Keep visible focus states, give icon-only controls an accessible name (aria-label) and respect prefers-reduced-motion.