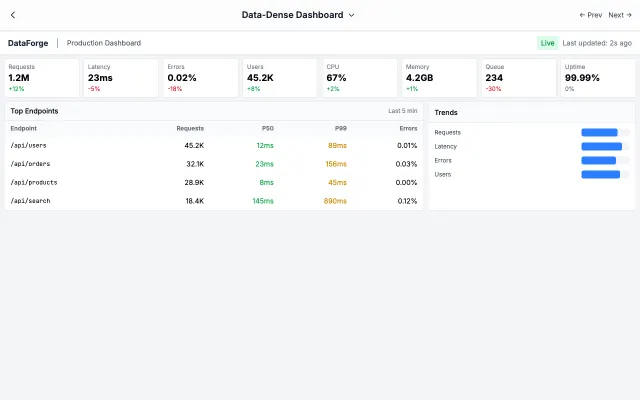
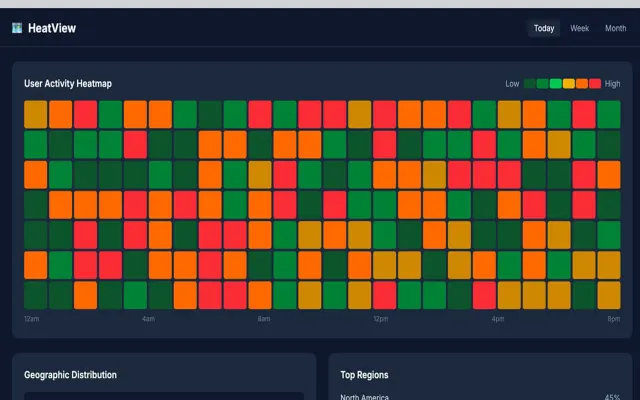
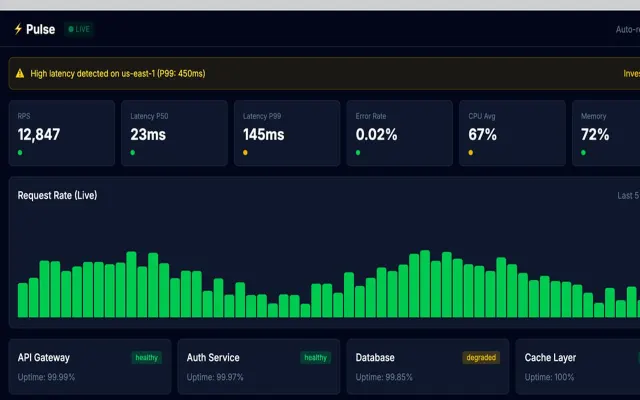
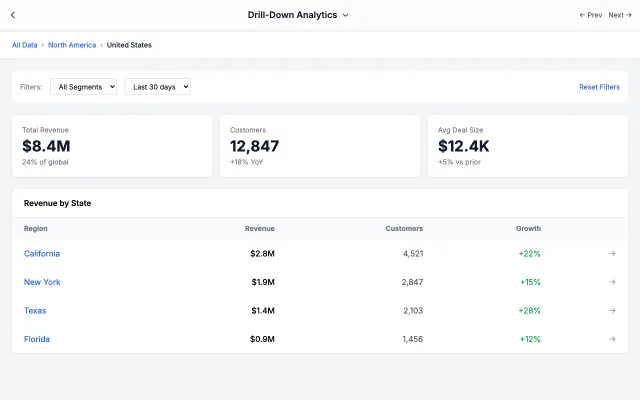
Distills complex data into key metrics. Large numbers, clear trends, and minimal noise for busy executives.
Era / origin
2020s Executive Tools
Key characteristics
KPI cards
High-level metrics
Clean layout
At-a-glance
Strategic view
Summary focused
When to use Executive Dashboard
C-suite summaries
Board reports
High-level monitoring
Status dashboards
Weekly reviews
When to avoid it
Detailed analysis
Technical users
Real-time monitoring
Complex workflows
Common industries
SaaS
Fintech & Banking
Corporate & B2B
Executive Dashboard color palette
#FFFFFF
#1F2937
#2563EB
#10B981
#EF4444
#F59E0B
#F3F4F6
How to build Executive Dashboard
Effects: Large KPI numbers, trend indicators, simple charts, drill-down on existing rows and cards, refresh animations
Open with four KPI cards: large bold value, label and one colored ▲/▼ change, replacing any existing arrow characters
Keep it to roughly one screen: KPI row, a simple bar or line trend plus a donut for mix, one compact table
Build charts and status colors from values already in the UI, such as existing bar heights and dot colors
If chart or status values are missing, draw one neutral skeleton chart with a single "Data pending" note, not per-item labels
Right-align table figures, abbreviate raw numbers with Intl.NumberFormat compact notation and color growth figures like the KPI deltas
Mark status with green, amber or red dots plus a text label; put the period and one Export action in the header
Use Executive Dashboard with an AI coding agent
Paste this into Claude Code, Cursor, v0, Lovable or any coding agent to restyle a page in Executive Dashboard.
AI prompt · 20 lines
Apply the Executive Dashboard style to this interface.

What it is: Distills complex data into key metrics. Large numbers, clear trends, and minimal noise for busy executives.
Look and feel: KPI cards, High-level metrics, Clean layout, At-a-glance, Strategic view, Summary focused.
Colors: primary #FFFFFF, #1F2937, #2563EB; secondary #10B981, #EF4444, #F59E0B, #F3F4F6.
Effects and motion: Large KPI numbers, trend indicators, simple charts, drill-down on existing rows and cards, refresh animations.

How to build it:
- Open with four KPI cards: large bold value, label and one colored ▲/▼ change, replacing any existing arrow characters
- Keep it to roughly one screen: KPI row, a simple bar or line trend plus a donut for mix, one compact table
- Build charts and status colors from values already in the UI, such as existing bar heights and dot colors
- If chart or status values are missing, draw one neutral skeleton chart with a single "Data pending" note, not per-item labels
- Right-align table figures, abbreviate raw numbers with Intl.NumberFormat compact notation and color growth figures like the KPI deltas
- Mark status with green, amber or red dots plus a text label; put the period and one Export action in the header

Works best for: C-suite summaries, Board reports, High-level monitoring, Status dashboards, Weekly reviews.
Avoid it for: Detailed analysis, Technical users, Real-time monitoring, Complex workflows. If this product falls into one of those, say so before restyling.

Restructure the layout where this style calls for it, keeping the existing content and behaviour. Use only content already on the page: if a step needs testimonials, pricing, data, images or media that don't exist, skip that step instead of adding placeholders or inventing it.
Meet WCAG AA contrast: where a palette color is too light or bright for text, keep it for backgrounds, borders and large display type and use a darker text color, rather than darkening the whole design. Keep visible focus states, give icon-only controls an accessible name (aria-label) and respect prefers-reduced-motion.